Introduction
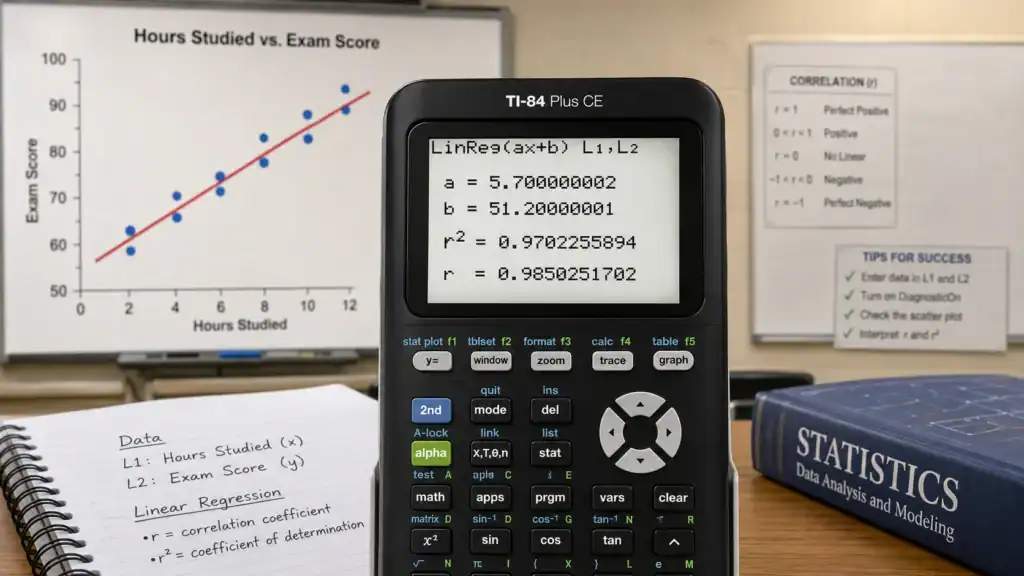
Calculating the correlation coefficient on a TI-84 calculator is an essential skill for statistics, AP Statistics, and data analysis. The calculator computes both r (the Pearson correlation coefficient) and r² (the coefficient of determination) from paired sample data. The value of r measures the strength and direction of a linear relationship, while r² tells you what percentage of variation in your dependent variable is explained by your regression line.
If you are practicing statistics without a physical calculator, you can follow every step directly in our free browser-based TI-84 Calculator Online.
Practice Linear Regression Live Online
Enter your data lists in L1 and L2 and calculate r and r² instantly on our interactive online TI-84 simulator.
What Is the TI-84 Correlation Coefficient?
The correlation coefficient (r) measures the strength and direction of a linear association between two quantitative variables. The value always ranges between -1.0 and +1.0:
| Correlation (r) | Interpretation |
|---|---|
| +1.00 | Perfect positive linear correlation |
| +0.70 to +0.99 | Strong positive correlation |
| +0.40 to +0.69 | Moderate positive correlation |
| +0.10 to +0.39 | Weak positive correlation |
| 0.00 | No linear correlation |
| -0.10 to -0.39 | Weak negative correlation |
| -0.40 to -0.69 | Moderate negative correlation |
| -0.70 to -0.99 | Strong negative correlation |
| -1.00 | Perfect negative linear correlation |
What Is r² (Coefficient of Determination)?
The TI-84 also outputs r². This value represents the proportion of variance in the dependent variable (y) that is predictable from the independent variable (x).
For example, if r = 0.90, then r² = 0.81. This means 81% of the variation in the response variable is explained by the linear regression model, while the remaining 19% is due to unexplained factors or random variation.
Step-by-Step Instructions: Calculating r and r²
Step 1: Enter Your Data into Lists
- Press
[STAT]and select1:Edit.... - Enter your independent (x) data into column L1.
- Enter your dependent (y) data into column L2.
- Ensure both lists have the exact same number of entries.
Step 2: Turn On DiagnosticOn (Crucial Step)
By default, many TI-84 models have statistical diagnostics turned off, which hides r and r². You only need to enable this once:
- Press
[2ND]followed by[0]to open the[CATALOG]. - Scroll down alphabetically to
DiagnosticOn(or press the[D]key). - Press
[ENTER], then press[ENTER]again until the screen displays Done. - Alternative (TI-84 Plus CE): Press
[MODE], scroll down to STAT DIAGNOSTICS, and select ON.
Step 3: Run Linear Regression
- Press
[STAT]and arrow right to the CALC menu. - Choose
4:LinReg(ax+b)and press[ENTER]. - Verify that
Xlistis set to L1 andYlistis set to L2. - Scroll down to Calculate and press
[ENTER].
The calculator displays the slope (a), y-intercept (b), coefficient of determination (r²), and correlation coefficient (r).
Worked Example: Study Hours vs. Exam Score
Suppose you collect data comparing study hours (L1) to exam scores (L2):
| Hours Studied (L1) | Exam Score (L2) |
|---|---|
| 2 | 60 |
| 4 | 68 |
| 6 | 76 |
| 8 | 84 |
| 10 | 92 |
After running LinReg(ax+b), the TI-84 displays:
a = 4(Score increases by 4 points per hour studied)b = 52(Estimated baseline score with 0 study hours)r² = 1.0(100% of score variation is explained by study hours)r = 1.0(Perfect positive linear correlation)
Common Mistakes to Avoid
- Missing r and r² on Screen: Diagnostics are turned off. Enable
DiagnosticOnfrom the Catalog. - ERR: DIM MISMATCH: Column L1 and column L2 have unequal numbers of rows. Check your data entries.
- Swapping X and Y: Ensure the explanatory variable is in L1 and the response variable is in L2.
- Assuming Correlation Equals Causation: A high r value proves a strong mathematical association, but does not prove one variable causes the other.
Frequently Asked Questions
Why does my TI-84 show only a and b without r?
Press [MODE] > enable STAT DIAGNOSTICS: ON, or run DiagnosticOn from [2ND] + [0].
Can the correlation coefficient be greater than 1 or less than -1?
No. By definition, r is strictly bounded between -1.0 and +1.0. If a calculation yields a number outside this range, check your inputs for errors.
Summary
The TI-84 makes computing linear correlation and regression fast and straightforward. Remember to verify equal list lengths, keep DiagnosticOn enabled, and inspect a scatter plot to confirm linearity. Test this feature today on our online TI-84 calculator!

Dr. Vivienne Blackwell is a mathematics and educational technology specialist focused on TI-84 calculator online tools, graphing calculator simulations, algebra, calculus, and statistics problem-solving systems. She creates structured and optimised guides that explain how to use TI-84 emulators and online calculator platforms for accurate equation solving, function graphing, and exam-focused mathematical analysis.