📂 TI-84 Online Calculator

How to Solve Limits Using a TI-84 Calculator

By Dr. Vivienne Blackwell · · 8 min read
How to Solve Limits Using a TI-84 Calculator

Introduction

Limits form the foundation of calculus. They help students understand how functions behave near a specific value. Many calculus problems require finding a limit before evaluating derivatives or integrals.

Students often struggle with limits that produce indeterminate forms such as 0/0. Algebraic methods can solve many of these problems. However, calculators can help verify answers and improve understanding.

The TI-84 calculator offers an effective way to estimate limits. While it cannot calculate symbolic limits directly, it can display numerical values and graphs near a target point. These features help students identify the value a function approaches.

This guide explains how to solve limits using a TI-84 calculator. You will learn table methods, graph methods, one-sided limits, common mistakes, and practical tips.

What Is a Limit?

A limit describes the value a function approaches as the input approaches a specific number.

Consider the limit:

lim x→2 (x²)

This expression asks what value x² approaches when x gets very close to 2.

Since:

2² = 4

The limit equals 4.

A limit focuses on nearby values. It does not always depend on the function’s actual value at that point.

When Should You Use a TI-84 Calculator for Limits?

The TI-84 helps in several situations:

  • Check homework answers
  • Verify algebraic solutions
  • Explore function behavior
  • Analyze discontinuities
  • Evaluate one-sided limits
  • Prepare for calculus exams
  • Visualize function trends

The calculator estimates limits through numerical and graphical methods.

Can the TI-84 Calculate Limits Directly?

No.

The TI-84 does not include a built-in symbolic limit command.

Instead, it estimates limits using:

  • Tables
  • Graphs
  • Trace functionality

These tools provide accurate approximations for most calculus problems.

Method 1: Solve Limits Using the Table Feature

The table method provides one of the easiest ways to estimate a limit.

You examine function values close to the target number. Then you identify the value those outputs approach.

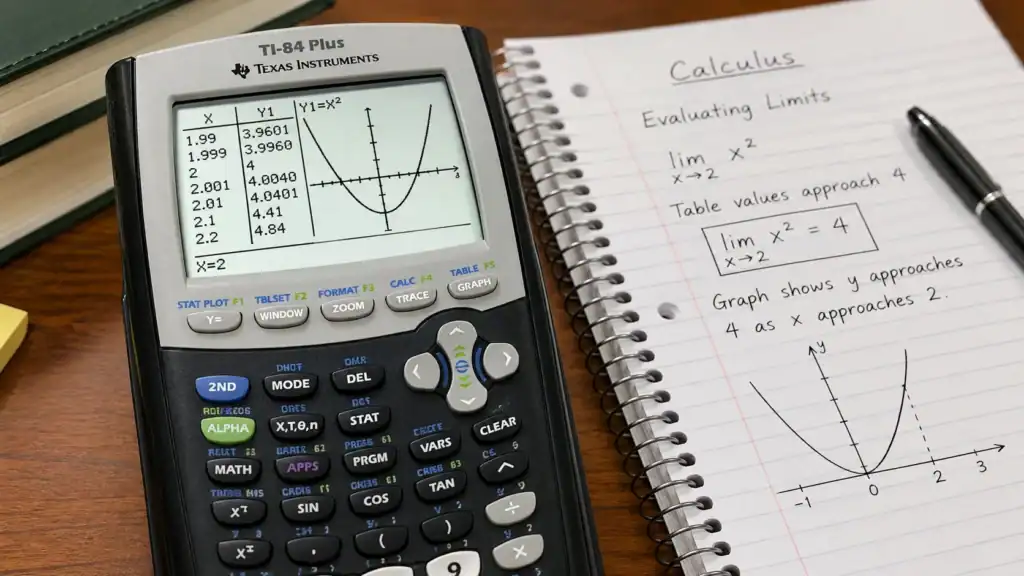
Example 1: Evaluate lim x→2 (x²)

Step 1: Open the Y= Editor

Press:

Y=

Step 2: Enter the Function

Type:

Step 3: Open Table Setup

Press:

2ND → WINDOW

This opens the TBLSET menu.

Step 4: Configure the Table

Set:

TblStart = 1.9

ΔTbl = 0.01

These settings create values close to 2.

Step 5: Open the Table

Press:

2ND → GRAPH

Step 6: Examine Values Near x = 2

You may see values similar to these:

xy
1.993.9601
1.9993.996001
2.0014.004001
2.014.0401

The outputs move closer to 4.

Answer

lim x→2 (x²) = 4

Why the Table Method Works

A limit depends on nearby values.

The table displays outputs immediately before and after the target number.

When values from both sides approach the same result, that result is the limit.

This method works especially well for:

  • Rational functions
  • Polynomials
  • Removable discontinuities
  • One-sided limits

Method 2: Solve Limits Using the Graph Feature

Graphs help visualize how a function behaves near a point.

This method complements the table approach.

Example 2: Evaluate lim x→3 (x² − 1)

Step 1: Enter the Function

Press:

Y=

Enter:

X² − 1

Step 2: Graph the Function

Press:

GRAPH

The calculator displays the curve.

Step 3: Activate TRACE

Press:

TRACE

Move the cursor near x = 3.

Step 4: Observe the Output

Near x = 3:

3² − 1 = 8

The graph approaches y = 8.

Answer

lim x→3 (x² − 1) = 8

Why the Graph Method Helps

Graphs reveal important details that tables may hide.

You can quickly identify:

  • Holes
  • Jumps
  • Vertical asymptotes
  • End behavior
  • Infinite limits

Graphs also improve conceptual understanding.

Many students understand limits faster through visualization.

Worked Example 3: Linear Function

Evaluate:

lim x→4 (2x + 5)

Step 1: Enter the Function

Type:

2X + 5

Step 2: Open the Table

Check values near x = 4.

xy
3.9912.98
3.99912.998
4.00113.002
4.0113.02

The values approach 13.

Answer

lim x→4 (2x + 5) = 13

Linear functions produce straightforward limits because they remain continuous everywhere.

Worked Example 4: Removable Discontinuity

Evaluate:

lim x→1 [(x² − 1)/(x − 1)]

Step 1: Understand the Function

Substituting x = 1 produces:

0/0

This result creates an indeterminate form.

Step 2: Factor the Numerator

x² − 1 factors into:

(x − 1)(x + 1)

The expression simplifies to:

x + 1

for all values except x = 1.

Step 3: Enter the Original Function

Type:

(X² − 1)/(X − 1)

Step 4: Check Values Near x = 1

xy
0.991.99
0.9991.999
1.0012.001
1.012.01

The outputs approach 2.

Answer

lim x→1 [(x² − 1)/(x − 1)] = 2

This example demonstrates a removable discontinuity. The function remains undefined at x = 1, but the limit still exists.

Understanding One-Sided Limits

Some calculus problems require one-sided limits.

A one-sided limit examines values from only one direction.

Left-Hand Limit

A left-hand limit approaches the target value from smaller numbers.

For x approaching 2:

  • 1.9
  • 1.99
  • 1.999

These values come from the left side.

Right-Hand Limit

A right-hand limit approaches the target value from larger numbers.

For x approaching 2:

  • 2.1
  • 2.01
  • 2.001

These values come from the right side.

How to Check One-Sided Limits on a TI-84

Use the table feature.

Choose values only from one side of the target number.

Compare the outputs.

If both one-sided limits match, the overall limit exists.

If they differ, the limit does not exist.

Common Mistakes When Solving Limits on a TI-84

1. Looking at the Function Value

Students often focus on the actual function value.

A limit examines what the function approaches.

These values may differ.

2. Using Large Table Increments

Large increments reduce accuracy.

Avoid settings like:

ΔTbl = 1

Use smaller values such as:

ΔTbl = 0.01

or

ΔTbl = 0.001

3. Checking Only One Side

Always examine both sides of the target number.

This step prevents incorrect conclusions.

4. Ignoring Graph Window Settings

Poor window settings can distort graphs.

Reset the standard view by pressing:

ZOOM → 6:ZStandard

5. Using Too Few Data Points

One nearby value provides little information.

Use several values from both directions.

This approach improves accuracy.

Tips for Accurate Limit Estimation

Follow these best practices:

  • Use small table increments
  • Check both directions
  • Zoom in near discontinuities
  • Compare graphs and tables
  • Verify answers algebraically
  • Use TRACE for additional confirmation
  • Examine several nearby values

These habits produce reliable results.

Can the TI-84 Evaluate Infinite Limits?

Yes.

The calculator can help identify infinite limits.

Consider a function with a vertical asymptote.

As x approaches the asymptote, the outputs may increase without bound or decrease without bound.

Tables and graphs can reveal this behavior.

Look for rapidly growing positive or negative values near the target point.

Frequently Asked Questions

Does the TI-84 Have a Limit Function?

No.

The TI-84 does not include a symbolic limit command.

It estimates limits through tables and graphs.

Can the TI-84 Solve One-Sided Limits?

Yes.

Use nearby values from only one side of the target number.

Why Does the Calculator Show Undefined?

The function may be undefined at that point.

However, the limit can still exist.

Removable discontinuities often create this situation.

Which Method Is More Accurate?

Tables usually provide more precise estimates.

Graphs provide better visualization.

Use both methods together for the best results.

Can the TI-84 Handle Calculus Coursework?

Yes.

The calculator supports many calculus topics.

These include limits, derivatives, integrals, and graph analysis.

Conclusion

The TI-84 calculator provides a practical way to estimate limits. It helps students visualize function behavior and verify algebraic work. While the calculator cannot compute symbolic limits directly, its table and graph features offer reliable approximations.

The process remains simple:

  1. Enter the function.
  2. Open the table or graph.
  3. Examine values near the target number.
  4. Check both sides.
  5. Identify the value the function approaches.

Regular practice improves speed and accuracy. With proper use, the TI-84 becomes a valuable tool for mastering limits and building a stronger foundation in calculus.

Tags: #Best TI 84 Calculator Online #Graphing Calculator TI-84 Online #TI-84 Calculator Online
Dr. Vivienne Blackwell

Dr. Vivienne Blackwell is a mathematics and educational technology specialist focused on TI-84 calculator online tools, graphing calculator simulations, algebra, calculus, and statistics problem-solving systems. She creates structured and optimised guides that explain how to use TI-84 emulators and online calculator platforms for accurate equation solving, function graphing, and exam-focused mathematical analysis.